A pure XSLT/SVG pie chart
The Problem: Create a pie chart in SVG from a set of values in XML using XSLT alone
The main issues here are:
- XSLT doesn't natively have much maths processing power. This can be supplied by extensions, but limits the portability of the solution.
- SVG draws elliptical curves (perfect for the outer edge of the pie slice) known point to known point, and can't calculate these from angles, which means in this case it needs to get the coordinates supplied. And XSLT without extensions can't calculate these.
A Solution: Clipping Paths
There are a number of ways to get close to the solution by overlaying pie slices, but to make the solution functional, each slice should be capable of standing on its own (for example, to support 'exploded' pie slices).
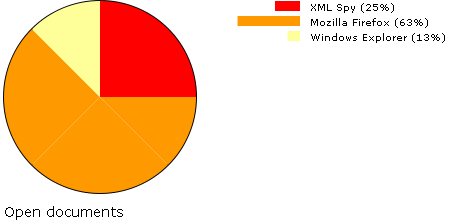
This solution uses the previous slice's position to clip the current slice. It's a bit rough at the moment, and not parameterized. It might be better to use single segments rather than 90° blocks to make up the larger slices, as you can see rendering lines here. There's also no way to generate colours if they aren't supplied in the XML datalist document.
 Screenshot linking to XML plus XSLT into SVG
Download

This software is licenced under the
CC-GNU GPL.
Zipped archive of pie chart demo files.